Quick Stats is a map portal which interactively display Population and Housing information collected in the Sri Lanka Census of Population and Housing - 2012 (CPH 2012) in thematic maps as well as table formats at National, District and Divisional Secretariat levels. This census map portal facilitates to filter data according to a given legend with 3 types of fixed legends which divides data according to Natural breaks, Equal Counts and Equal widths. Getting the so created thematic maps with the selected legend printed for third party publications and presentations also facilitated by the Quick Stats.
The following graphics and texts formally explain how to get a specific task done within the Quick Stats Map portal and answers to related FAQs.
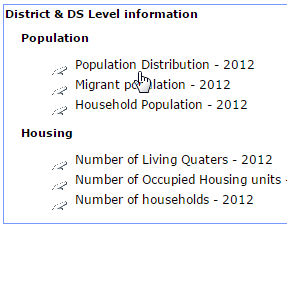
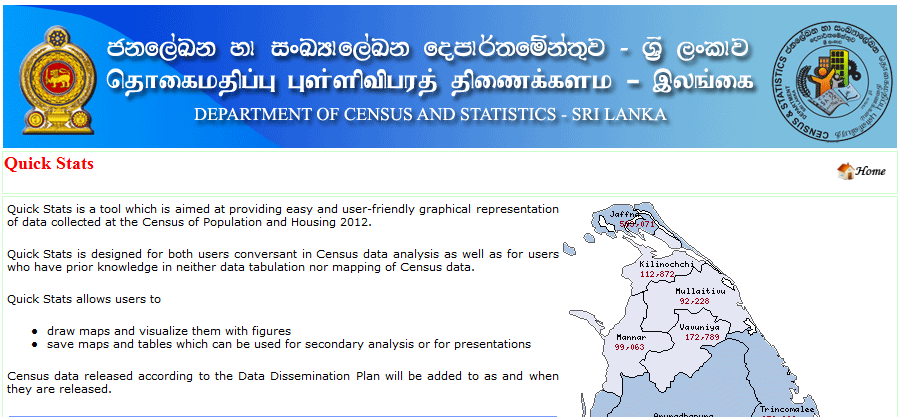
The home page of the Quick Stats provides a brief introduction to the system and prompts user to select Data category of the Census as shown in the figure. When a data category was selected the census thematic map with the default legend is called with the available data tables displayed at right hand side of the map portel.
With a census data category the district total of the category based thematic map is shown and all the data tables related to the base census category are displayed at right hand side of the map.
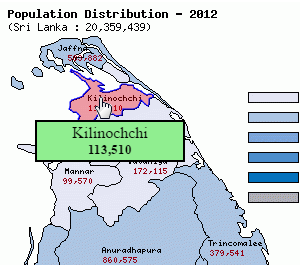
To get district total and district table data the user has to select the district by clicking or moving the mouse pointer on to district for which the data tables are needed. Upon moving the mouse pointer to a district of the district thematic map the data tables at right side of the window display the data values related to the selected district and the district total for the census data category for selected district is shown as pop-up box on the selected district.
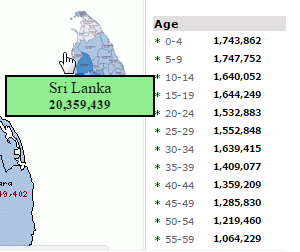
To show national level total and data tables the small map of Sri Lanka at right side of the thematic map has to be selected. Upon moving the mouse pointer to the small Sri Lanka map from the district map the data tables at right side of the window display the national values and the small map shows the total for all the tables as pop-up box on it.
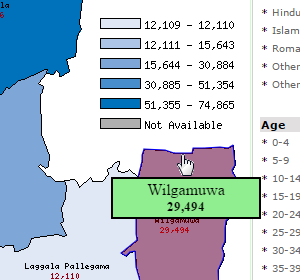
To show District level maps and data tables with Divisional Secretariat Division (DSD) data and the district thematic map a district from the map of Sri Lanka should be selected by clicking on the desired district. Upon moving the mouse pointer on the resulting District map the tables would display the data related to the DSD which the mouse is currently kept on.
The DSD included district map also behaves similar to the National level map and the data and the thematic map of the district view also may be saved and printed out as per the user wish.
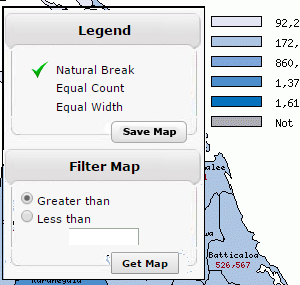
The Quick Stats map portal is fitted with a flexible legend, which could be easily changed interactively between Natural breaks, Equal counts and Equal widths of the data values used to draw the thematic map view. Upon selecting a legend the legend as well as the thematic map is re-drawn to suit the newly calculated data ranges.
The other option is to draw the thematic map with 2 user preferred data ranges and to get thematic map for a value above or less than a given value the user has to select the desired above or less than radio box and the cut point data value. In this display, which is called upon selecting the Get map button the data is divided from zero to the given value and values lie above from it.
The Save button located at the legend selection box prints the map as an image to the screen and this image could be saved and then print to any desired destination.
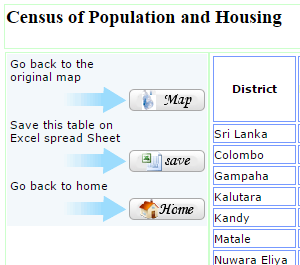
The Data buttons located at top right hand side of the data tables and left hand side pane of the map are to display the data tables of the selected region.
The Save buttons located at top right hand side and left hand side pane of the data tables are to down load the data into .csv format.